Music Charts
Personal music charts from 20 years of listening data. Heart Top 100 vs. algorithmic inflation, decade charts styled to their era, yearly rankings, and newcomer discoveries.
run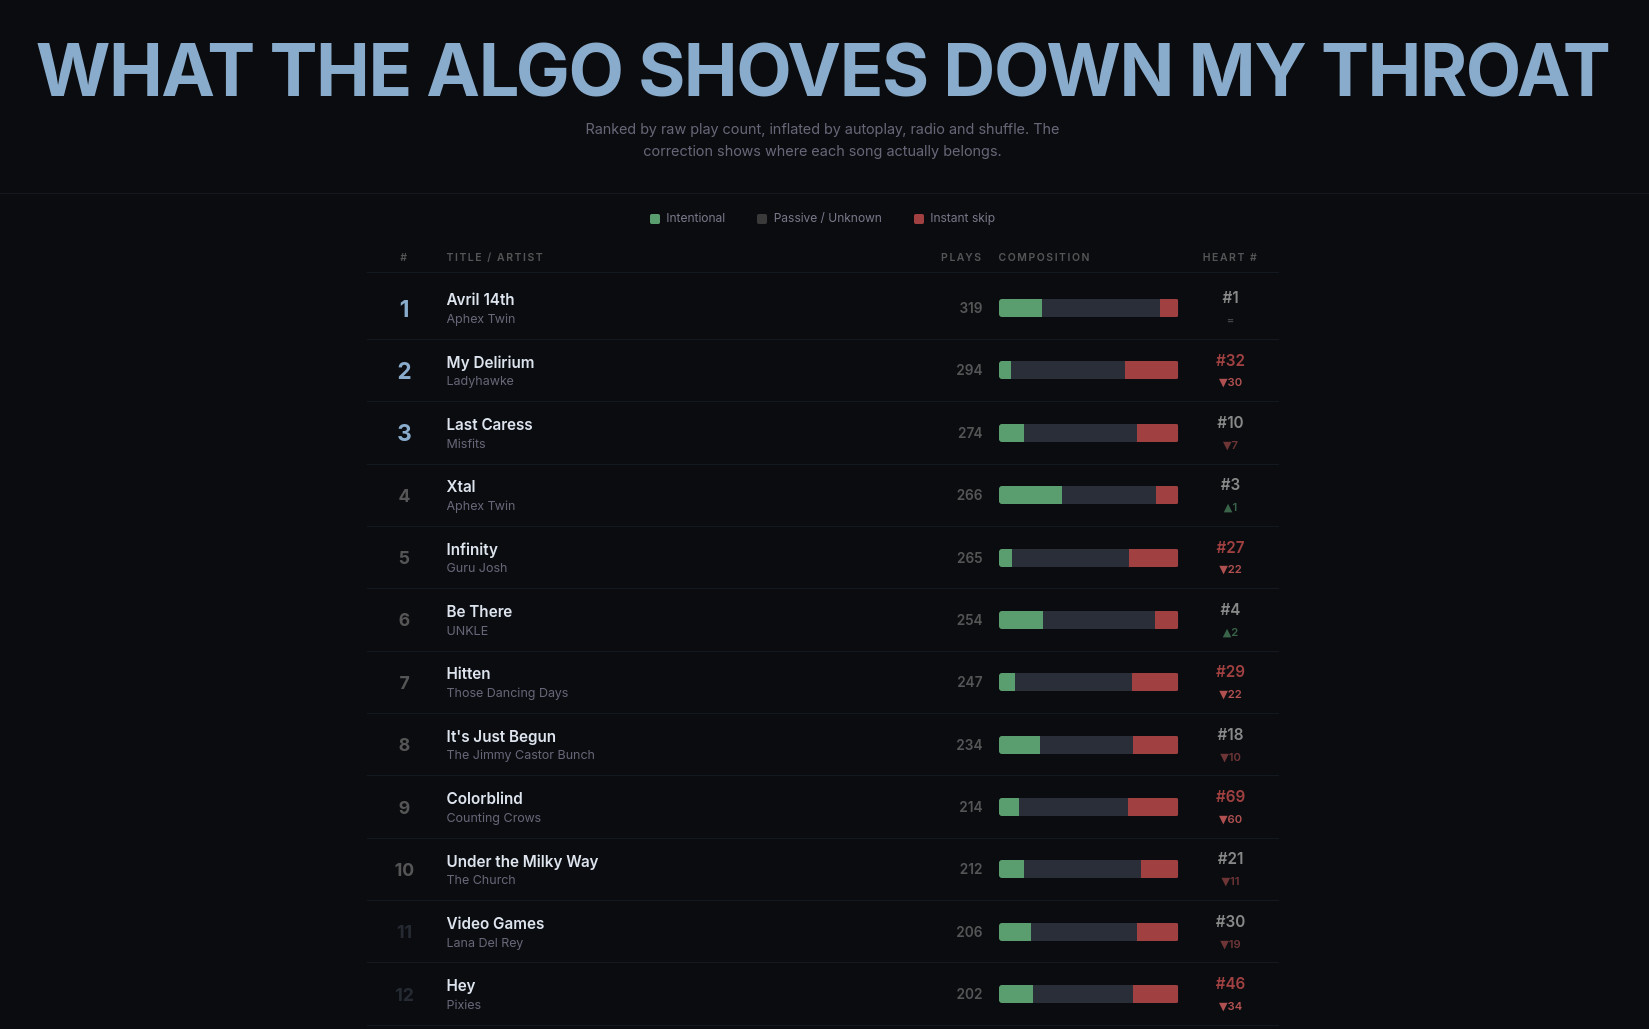
documentation
Day 002 — Music Charts
Personal music charts spanning 20 years of listening history (2005-2026).
Charts
- Heart Top 100 — Songs ranked by intentional plays, penalizing instant skips and algorithmic inflation. Anomaly detection normalizes years with high skip rates.
- Algo Top 100 — Raw play count ranking with correction column showing where each song lands in the organic scoring.
- Decade Charts — Top 100 songs and albums per decade, styled to match the era: classic billboard (pre-2000), web 1.0 (2000s), flat design (2010s), Spotify-style (2020s).
- Yearly Charts — Year-end top songs and albums for each year, automatically styled by era.
- Newcomer Top 20 — Artists and tracks first heard in the last 12 months.
Use with your own data
You can generate your own charts from your personal listening history.
Prerequisites
- Python 3.10+
pip install duckdb requests
1. Get your data
Spotify: Request your Extended Streaming History at spotify.com/account/privacy. Place the Streaming_History_Audio_*.json files in raw-data/spotify/.
Last.fm / ListenBrainz: If you have a Last.fm account, you can import your scrobble history into ListenBrainz (there's a built-in Last.fm importer). Then export your listens and place the monthly JSONL files in raw-data/listenbrainz/listens/YEAR/MONTH.jsonl. You can use Spotify, ListenBrainz, or both.
2. Optional: API enrichment
Create a .env file for additional metadata:
LASTFM_API_KEY=your_key_here
LASTFM_SHARED_SECRET=your_secret_here
SPOTIFY_CLIENT_ID=your_id_here
SPOTIFY_CLIENT_SECRET=your_secret_here
Get a free Last.fm API key at last.fm/api/account/create. Get Spotify credentials at developer.spotify.com.
Then run the enrichment scripts (optional, improves genre charts):
python scripts/ingest.py                # raw data → DuckDB
python scripts/enrich_musicbrainz.py    # genres, tags, labels (~1h)
python scripts/enrich_wikidata.py       # coordinates, founding years (~2min)
python scripts/enrich_lastfm.py         # global popularity, similar artists
python scripts/enrich_spotify.py        # artist genres, track popularity
3. Generate charts
python scripts/export_billboard_data.py # → charts/*.json
The charts/ directory now contains the JSON data files. Open index.html in a browser (via any local HTTP server) to view your charts.
Data normalization
Edit scripts/normalize.py to customize:
EXCLUDE_ARTISTS— audiobooks, podcasts, non-music to filter outARTIST_MERGES— fix variant spellings (e.g., "José González" / "Jose Gonzalez")TRACK_RENAMES— fix mis-scrobbles and merge duplicate tracks
Stack
- Vanilla JS + Google Fonts for themed chart rendering
- Pre-computed JSON data (~444 KB total)
- DuckDB + Python for local data processing
- Static deployment on Cloudflare Pages
licenses
Google Fonts (SIL Open Font License). Data from personal Spotify export, ListenBrainz, and MusicBrainz (CC0).