365 days of vibecoding
one experiment per day. code, sound, visuals — in the browser.
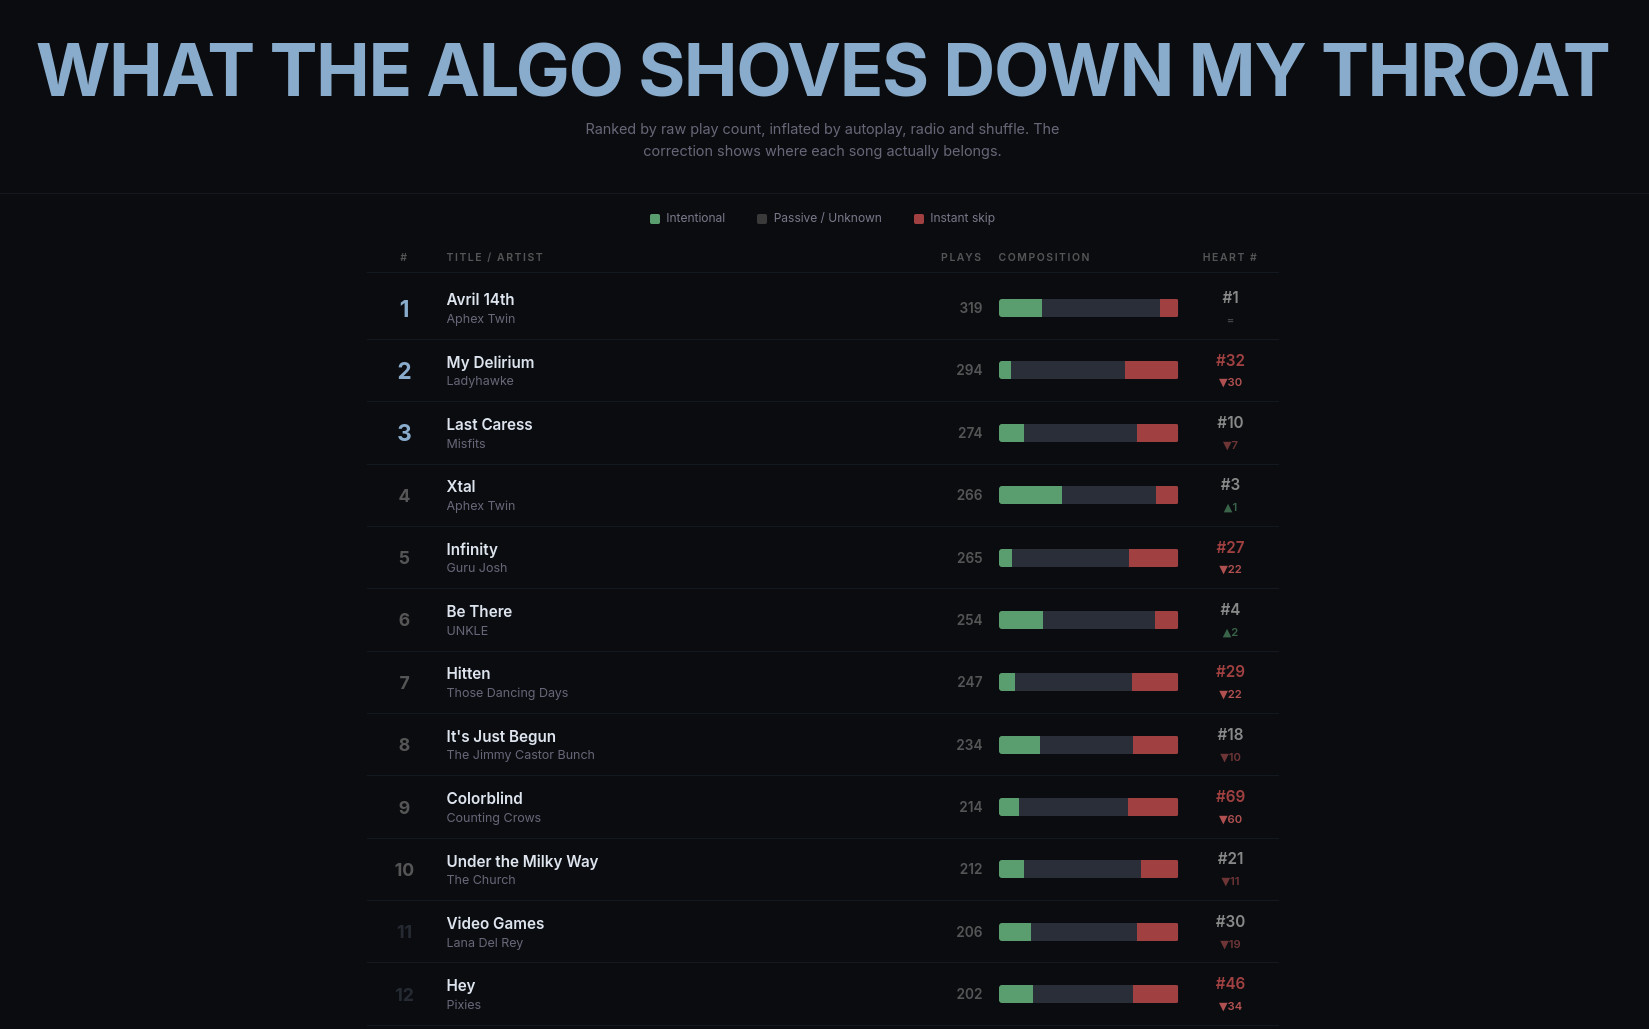
Music Charts
Personal music charts from 20 years of listening data. Heart Top 100 vs. algorithmic inflation, decade charts styled to their era, yearly rankings, and newcomer discoveries.
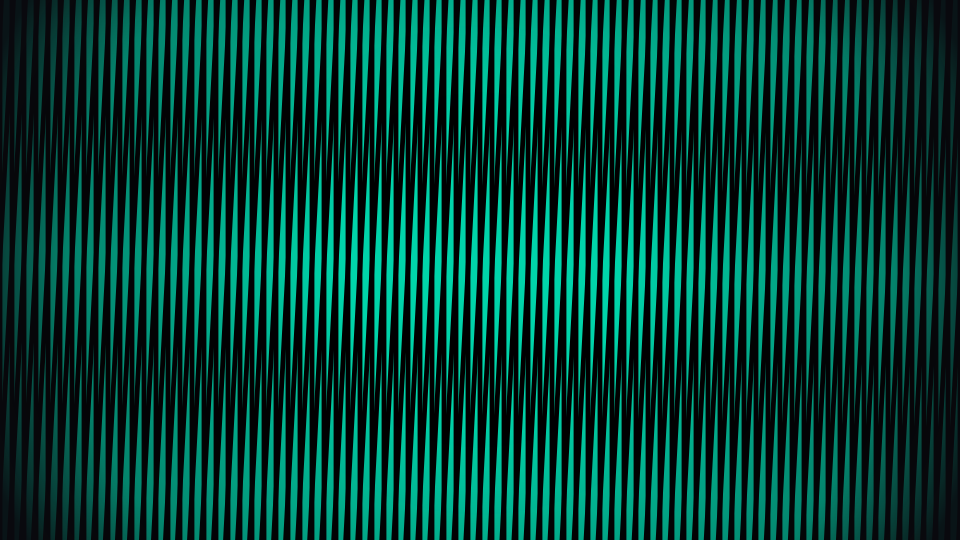
Moiré Explorer
Interactive exploration of five moiré interference effects with per-parameter LFO automation. Photosensitivity warning: contains rapidly changing high-contrast patterns.
Template — Project Scaffold
Structural template for new daily projects. Demonstrates all meta.json fields and the expected directory layout at full extent.